GeneLinea Help
GeneLinea's goal is to be very easy to use, so you as a biologist can spend more time focusing on your data rather than learning the command line interface and programming. But we all run into problems now and again. This is the help/FAQ section that can hopefully guide you. If you continue to have issues please email the author.
Application Overview
Here is a visual walkthrough of how GeneLinea works from start to finish:
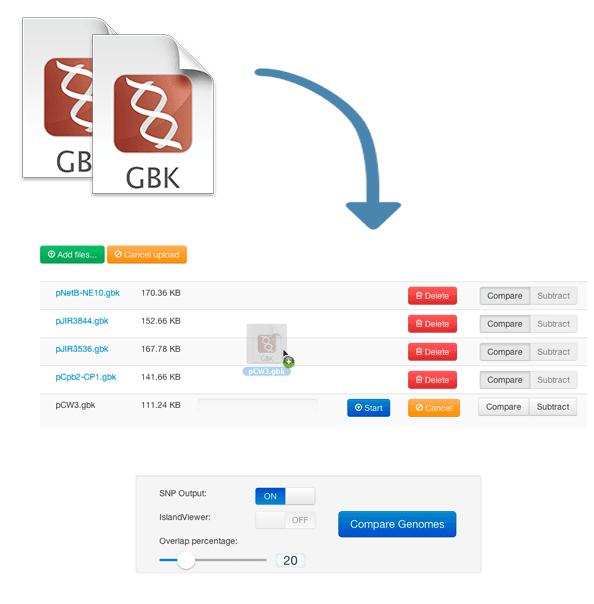
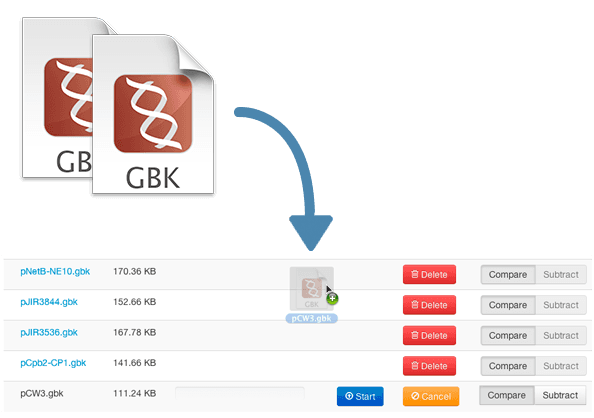
Step 1: Upload Your Genomes
Start by uploading your GenBank files. You can drag and drop files or click to browse. Designate each genome as "Compare" or "Subtract".
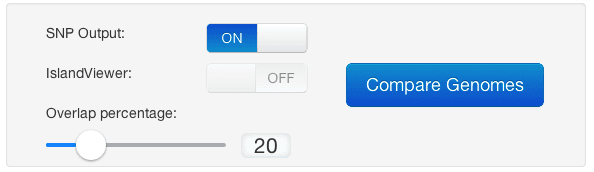
Step 2: Configure Options
Set your comparison name, overlap percentage, and enable SNP detection if needed.
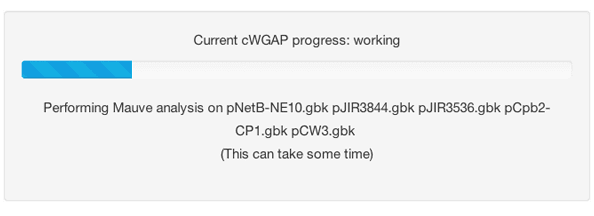
Step 3: Processing
Watch real-time progress as your genomes are aligned and analyzed.
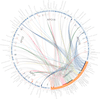
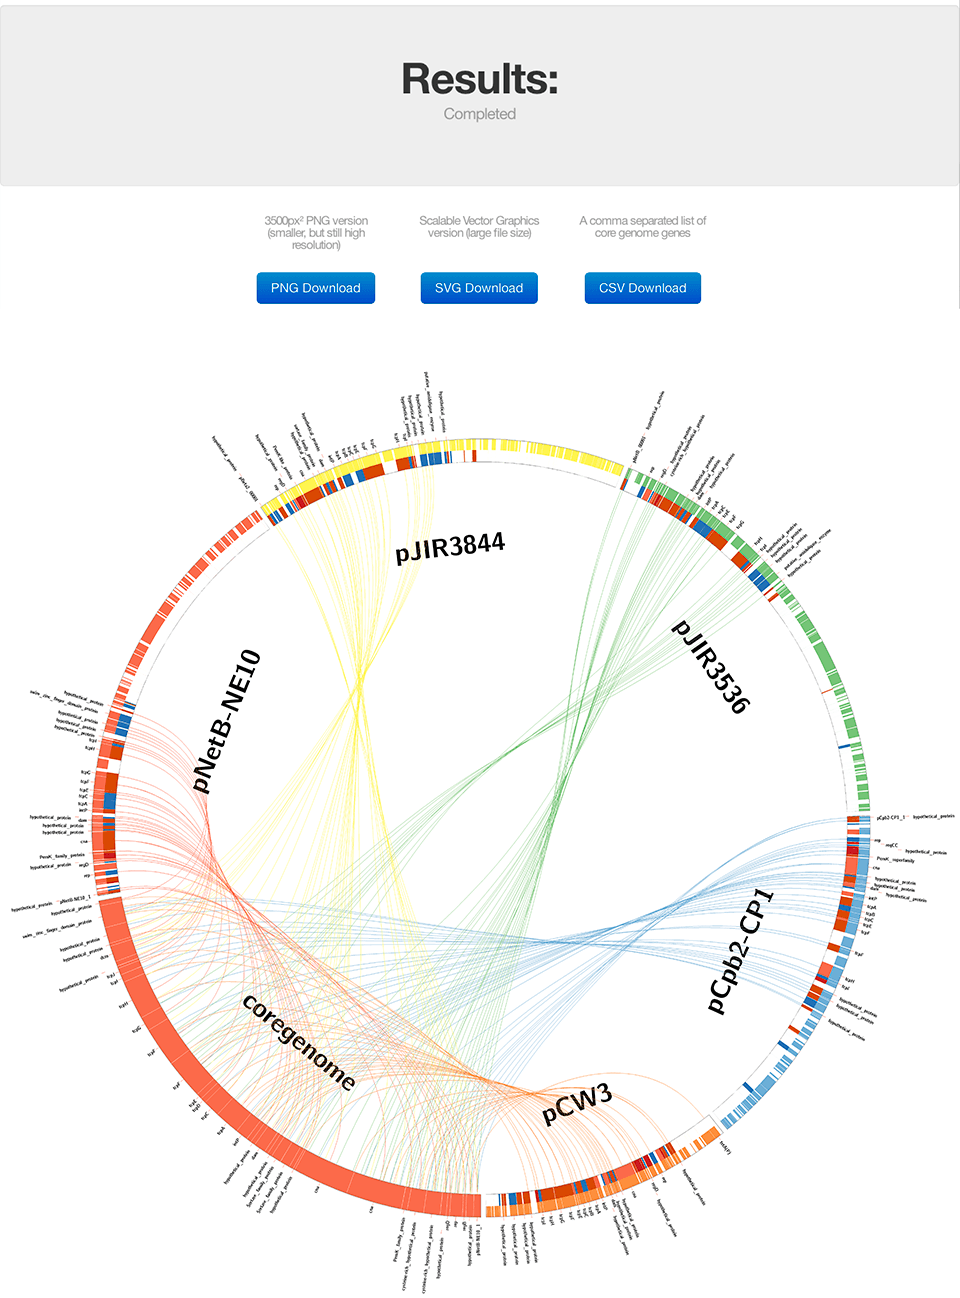
Step 4: View Results
Explore your Circos visualization showing genomic relationships and shared regions.
Sample Files
If you are new to GeneLinea and want to see how it works and do not currently have a dataset to work with, here are some files you can play with to see the framework in action.
| Download | Content | Avg Genome Size | Processing Time | # Comparisons |
|---|---|---|---|---|
| Clostridium plasmids zip | PLOSone Journal article* | 149 kilobases | 2 minutes | 5 genomes |
| APEC genomes zip | APEC paper coming out soon | 5 megabases | 14 minutes | 5 genomes |
* not affiliated - publicly available data and paper
Genome Annotation
The file format input must be Genbank (.gbk or .gb) format post annotation (automatic or manual). We have used Prokka for in-house use on our bacteria, and it runs flawlessly for rapid annotation of prokaryotic genomes in GeneLinea.
Although we use the FASTA sequence from the Genbank to run alignments - we use the Genbank annotations for the gene names. Your mileage may vary on results because of the irregularities. It is best to stay consistent (same annotation pipeline on all genomes). Often when GeneLinea fails, it is because of a poor annotation.
Finished Genomic Sequence
GeneLinea runs best when using finished sequence - it becomes less reliable with draft sequences, or poorly assembled genomes. Following the rule: Garbage in, garbage out.
Time it takes to process genomes
So how long will it take to run my stuff? Well, that depends on a lot of things. But we really tried to get the programming efficient as possible to prevent waiting a long time.
Also something to keep in mind: we programmed it with bacterial genomes in mind (~5MB) - anything more than this may take some serious time. But if you're working with large genomes, you are probably already used to this.
Estimated Processing Times:
- 2-3 bacterial genomes: ~2-5 minutes
- 4-6 bacterial genomes: ~5-15 minutes
- 7+ genomes or large files: 15+ minutes
GeneLinea Processing Options
We were trying to keep many options automated so this would be a straightforward process, and good for iterations (adding/subtracting genomes, etc). This is what we have boiled the user options down to:
| Option | Description |
|---|---|
| SNP Output | The SNP option toggles the track of SNPs to a heatmap. The more SNPs in a gene, the "hotter" (more red) it becomes. It calculates the upper limit dynamically. This uses considerable computation resources and increases time to compute. |
| Overlap Percentage | The overlap analysis has been included since there will be overlap with varying levels of similarity. A percentage overlap function was added so that the user can specify how much overlap in the genes and backbone is acceptable (i.e., the user sets the desired stringency for calling overlapping data). This step is iterative allowing the user to adjust the analysis to a particular dataset, beginning with the default setting of 85%. |
| Compare vs Subtract | Designate genomes to include in comparison (Compare) or exclude from results (Subtract). Compare genomes are aligned to find shared regions. Subtract genomes are used to filter out common regions. |
Understanding Results
After processing completes, you'll see a Circos visualization showing the relationships between your genomes:
Download Formats:
- PNG: High-resolution image for presentations
- SVG: Vector format, perfect for publications and editing
- CSV: Gene list with coordinates and annotations
NCBI Downloads
You can download GenBank files directly from NCBI for use in GeneLinea.
How to download from NCBI:
- Go to NCBI Genome
- Search for your organism of interest
- Click on the genome assembly
- Download the GenBank format file (.gbk or .gbff)